Salmon at Sea. Why are our salmon lost at sea?
- Ian Gordon

- Oct 21, 2017
- 10 min read

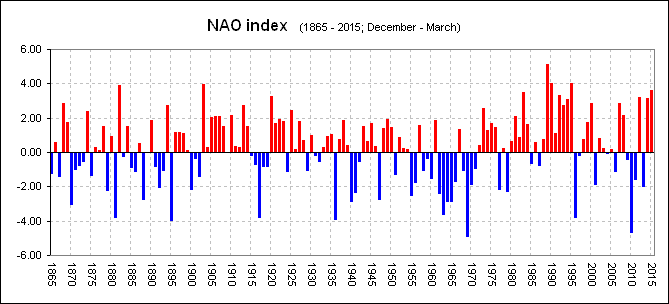
The interesting thing about the pictures above below is the period between 1950 and 1970, nearly all NAO – years = MSW Spring Salmon as the dominant fish component in all four big Scottish rivers.

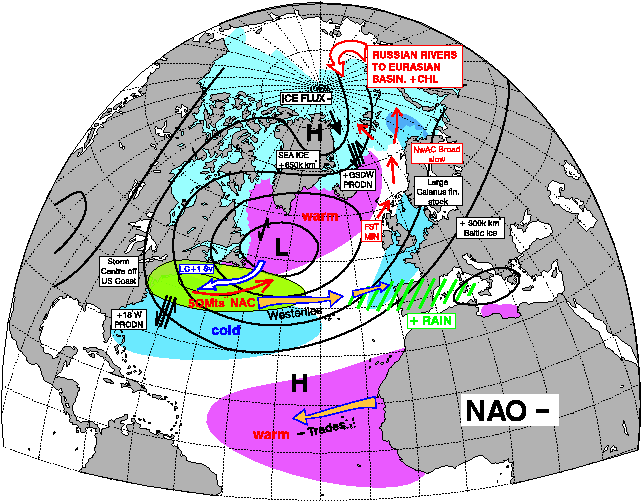
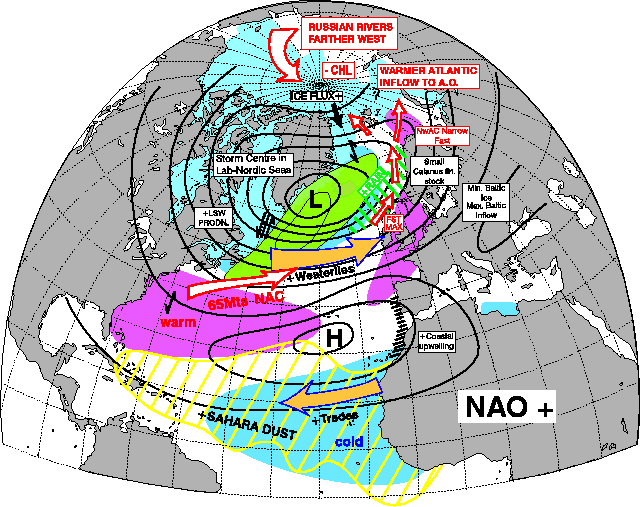
The vast majority of years between 1980 and 2000 have been NAO +. and as such Grilse were the main fish component. This is self-explanatory with a quick glance at the two pictures showing the effect of NAO + and NAO - below. Even to the point of 1978 and 1980 being good years for both Grilse and MSW Salmon! The spike down in the mid 1990s coincides also with a couple of decent years of spring fishing at a time when Grilse are still a dominant component, but I also think this was the first sign of a change!
North Atlantic Oscillation Index

By 2005 the change had become clear and our Grilse fishing here in Scotland had gone into free-fall. Important to understand, was, Just like the period 1875 and around 1900, a period we know to have been "relatively" poor for salmon numbers, the NAO was neither one or the other and had returned to "fluctuating" between years of high and low.
So, what effect would this have on our migrating salmon? Well, due to the difference in sea surface temperature, the obvious effect would be that Plankton [food] would not be available in the same part of the ocean at a particular time of the year. However, given periods where NAO is consistently one way or another, on a yearly basis, food would be found in the same part of the ocean as it was during the same time period the year before. Those are the periods where salmon do best in the ocean and marine survival is highest. No rocket science and all about the weathers influence on food.
What’s clear from the study below is, fluctuation in air mass means something that is very natural and creates a “see-saw” affect in sea surface temperatures on the east and west sides of the ocean, thus affecting plankton (food for juvenile fish) in those particular areas. A natural phenomenon that “100% must” affect the production of adult fish, particularly those making long migrations like Atlantic Salmon and answer the questions to why some periods are dominated by Grilse and others by Multi Sea Winter [MSW] salmon.
In addition to this we have a slight rise in the mean (overall) sea temperature, something which will obviously favour one species over another, and unfortunately for us salmon fishermen, right now, this doesn’t seem to be salmon.
So, does that mean salmon will become extinct? Not at all! They’re a highly adaptable survivor, however, their’s is a long game, played out over centuries and not simply years or decades to suit our appetite for catching and eating them. Unfortunately, their numbers naturally fluctuate. However, the last time numbers were this low we had no Drift nets, nor did we have commercial netting anywhere along their migration routes. Add to this the fact there were little or none Goosanders, seals were culled and those “managing” salmon rivers shot or killed anything that ate them. This is before we add the effects of Water Abstraction, forestry and farming drainage, massive increase in population along our rivers and insect populations changing beyond anyone’s understanding, all of which, obviously has a massive influence on our rivers ability to naturally produce juveniles and you have a “super problem” for salmon right now. Oh, I forgot fish-farms and the production of fish food!!
Of course, they will not become extinct, however, we must get used to far fewer returning to our shores. Unfortunate as this is, all those things above have upset the balance of nature, all leading to now, an “un-naturally” low number of fish in the ecosystem.
For those who would like to read the Scientific Evidence that backs up this theory. Please see below, Its been available for years and makes strong links between NAO and the survival of migratory fish in the ocean. Some may find this boring but never the less, very relevant !!
This study investigates a link between a large-scale atmospheric phenomenon, the North Atlantic Oscillation1-4, and fluctuations in the abundance of zooplankton species. Since copepods are the major component of the northeast Atlantic and North Sea zooplankton5-6, we focused on two dominant species: Calanus finmarchicus and C. helgolandicus. Long-term variations in abundance of these two species are closely associated with the state of this oscillation, although their responses to the NAO are opposite. We suggest that the relationship between the NAO and the two Calanus species results from three main processes: (i) alterations in the stratification of the surface layer that modify the spring phytoplankton bloom7-8, (ii) variations in sea surface temperature, and (iii) changes in interspecific competition. Finally it is hypothesized that the North Atlantic Oscillation plays, in the the North Atlantic, a comparable role to the El Niño Southern Oscillation, on pelagic ecosystems.
The North Atlantic Oscillation (NAO) is an alternation of air mass that occurs between the subtropical region (centred on the Azores), and the subpolar region (centred on Iceland). The state of NAO determines the speed and direction of the westerlies across the North Atlantic as well as temperatures on both sides of this ocean1-4, during winter and early spring. A high NAO pattern is characterised in the northeast Atlantic by a reinforcement of the westerlies that are pushed further south, and hence by warmer winter temperatures than normal. On the contrary, a low NAO pattern is typical of a weakening of the westerlies that are moved far north from their average position, and by colder winter temperatures. Recently, Greenland ice cores data have revealed large decadal climate variations over the North Atlantic that can be related to the NAO. It also appears that the persistence of an exceptionally strong positive phase of the NAO seems to be the source of recent temperatures anomalies and changes in atmospheric moisture transport10. Thus, the NAO is a large scale atmospheric phenomenon analogous to the El Niño Southern Oscillation (ENSO). These developments and previous studies that showed the influence of the ENSO on Pacific pelagic ecosystems, raise the question: does the NAO influence the pelagic ecosystems of the North Atlantic? We investigated the connections between the NAO and zooplankton from long-term monitorings of meteorological and plankton data. The NAO index indicates the state of this oscillation, a positive index corresponding to a high NAO pattern and a negative index to a low NAO pattern. Sea surface temperatures (SST) and west wind stress component (WWS) data were provided by the Comprehensive Ocean Atmosphere Data Set. The plankton data were collected by the Continuous Plankton Recorder survey (CPR)16, a routine monthly synoptic survey of plankton in the North Atlantic and North Sea. We studied two copepods species, Calanus finmarchicus and C. helgolandicus, which contitute the major component of the Northeast Atlantic and North Sea zooplankton5-6, in terms of biomass, abundance and trophic role, and which fulfil a similar function in the ecosystem. Our purpose was to examine the specific responses of these two species to that large scale phenomenon. We analysed long-term and year-to-year changes in abundance of the two Calanus species from 1962 to 1992, on a large area of the Northeast Atlantic, where the CPR sampling intensity was adequate. NAO and WWS show identical patterns in their long-term trends as well as in their year-to-year fluctuations (Fig. 1). The correlation between the two series is very high (r=0.85, p=1.10-9). The SST long-term pattern is also similar to that of the NAO (r=0.51, p=0.003). These results confirm that, in the studied area from 1962 to 1992, NAO, WWS intensity and SST are closely related during winter and early spring. C. helgolandicus and NAO have parallel long-term patterns (Fig. 1), and the two series are positively correlated (r=0.42, p=0.018). However, year-to-year fluctuations of the two series are not always synchronous, that explains the mediocre fit of the regression (Fig. 2a). Indeed, the correlation is maximum between the NAO index and the abundance of C. helgolandicus in the following year (r=0.53, p=0.002). Conversely, there is a very strong opposite relationship between NAO and C. finmarchicus (r=-0.76, p<1.10-6), that results from opposite long-term and year-to-year variations (Fig. 1). The regression shows a much better fit, and 58% of the annual abundance variations of this species are explained by the NAO (Fig. 2b). While connections between physical variables and NAO are expected, more striking is the close relationship between the NAO and the zooplankton species. Several authors17-19 have already pointed out a strong plankton-weather link, between biological groups (e.g. total copepods or total zooplankton) and single climatic variables (e.g. SST, wind component, Gulf Stream position). However, the present results suggest that the fluctuations in abundance of individual species are closely related to changes of a large scale atmospheric oscillation. C. finmarchicus is the more closely linked to the NAO. This relationship can be partially explained by extending the analysis of Dickson et al.8 on the connection between winds and plankton production. During high NAO, the reinforcement of the WWS generates a strong mixing of the surface layer in winter and spring. This enhanced mixing delays the spring phytoplankton bloom and reduces primary production7-8. Furthermore, during this period, SST are warmer than normal, which is unfavorable to C. finmarchicus, a cold-temperate water species20-22. The combination of these two negative circumstances, both driven by the NAO, probably induces the low abundances of C. finmarchicus observed during high NAO years (Fig. 3). On the contrary, low NAO is characterised by weak WWS which probably allows an earlier initiation and a higher rate of growth in the spring phytoplankton bloom. This ecological context, associated with colder SST than normal, is favorable to higher abundances of C. finmarchicus (Fig. 3). From low to high NAO years, abundance of C. finmarchicus decline by 44%. Because the long-term patterns of abundance of C. helgolandicus and C. finmarchicus are opposite (Fig. 1, r=-0.4, p=0.026), this analysis can not be evoked to explain the relationships between the NAO and C. helgolandicus. Nevertheless, C. helgolandicus response to the NAO can be clarified if we consider the spatial heterogeneity of the WWS within the studied area. In northern regions, where C. finmarchicus is predominant, WWS increases by 180% over their average values during high NAO, but only increase by 50% in southern regions, where C. helgolandicus is predominant. Thus, during high NAO, the rise in WWS would not be sufficient to reduce radically the spring phytoplankton bloom in southern regions, explaining why C. helgolandicus abundance in the Celtic Sea is comparable during two extreme NAO situations (Fig. 3). However, a noticeable feature is the high abundance of C. helgolandicus in the North Sea during high NAO years (Fig. 3). This probably results from two main circumstances: (i) low abundance of C. finmarchicus in the North Sea confers a competitive advantage to C. helgolandicus; (ii) C. helgolandicus, which is a warm-temperate waters species23-24, can take advantage of the high NAO warming effect. This might explain the 30% increase in C. helgolandicus abundance during high NAO years. Furthermore, these two circumstances mainly favour C. helgolandicus in the North Sea during autumn and hence probably an increase of the winter stock, that is likely to be reflected in the abundance during the following year as a function of species stock persistence. Although these two species are morphologically very close and occupy a similar place in the trophic web, their responses to the NAO are opposite. Effects of the NAO are likely to be modulated by the ecological and physiological properties of each species, such as geographic location, temperature affinity and interspecific competition. This opposition in species responses leads to a partial compensation in total Calanus abundance. Nevertheless, C. finmarchicus is the most abundant species in the studied area, and from low to high NAO there is an important and significant deficit of 18.5% of total Calanus abundance. Since these copepods constitute the main food resource for fish juveniles and regulate fish recruitment25-26, and since fish stock fluctuations are strongly linked to changes in hydro-climatic conditions27-28, NAO repercussions on North Atlantic fish populations are likely to be acute. Thus, we put forward that the NAO in the northeast Atlantic would play a comparable effect on pelagic communities to the ENSO in the Pacific. In conclusion, attempts to determine the effects of such large-scale climatic events on marine ecosystems require long-term monitoring of oceanic communities. Long-term surveys will help first to distinguish the natural variability from changes induced by human activities and, secondly will facilitate modelling of marine ecosystems (this study showed that two close species belonging to the same trophic level can respond in the opposite way to the same environmental forcing), which is a fundamental issue of JGOFS and GLOBEC programmes.
References 1 Van Loon, H. & Rogers, J.C. Mon. Wea. Rev. 106, 296-310 (1978). 2 Rogers, J.C. Mon. Wea. Rev. 112, 1999-2015 (1984). 3 Lamb, P.J. & Randy, A.P. Bull. Am. Meteor. Soc. 68, 1218-1225 (1987). 4 Mann, K.H. & Lazier, J.R.N. Dynamics of marine ecosystems. Biological- physical interactions in the oceans. (Blackwell Scientic Publications, Oxford, 1991). 5 Marshall, S.M. & Orr, A.P. The biology of a marine copepod. (Springer-Verlag, 2nd edition, 1972). 6 Williams, R. et al. Hydrobiologia 293, 521-530 (1994). 7 Sverdrup, H.U. J. Cons. Int. Explor. Mer 18, 287-295 (1953). 8 Dickson, R.R. et al. J. Plank. Res. 10, 151-169 (1988). 9 Barlow, L.K. et al. Geophys. Res. Lett. 20, 2901 (1993). 10 Hurrell, J.W. Science 269, 676-679 (1995). 11 Chelton et al. J. Mar. Res. 40, 1095-1125 (1982). 12 Barber, R.T. & Chavez, F.P. Science 222, 1203-1210 (1983). 13 McGowan, J.A. in El Niño North: Niño effects in the Eastern Subartic Pacific Ocean. (eds. Wooster, W. S. and Fuharty, D. L.) 166-184 (U.W., Seattle, 1985) 14 Mysak, L.A. Can. J. Fish. Aquat. Sci. 43, 464-497 (1986). 15 Karl, D.M. et al. Nature 373, 230-234 (1995). 16 Warner, A.J. & Hays, G.C. Prog. Oceanog. 34, 237-256 (1994). 17 Colebrook, J.M. Hydrobiologia 142, 309-325 (1986). 18 Aebisher, N.J. et al. Nature 347, 753-755 (1990). 19 Taylor, A.H. et al. J. mar. biol. Ass. U.K. 72, 919-921 (1992). 20 Carlotti, F. et al. Limnol. Oceanogr. 38, 1125-1134 (1993). 21 Hirche, H.J. Mar Biol. 94, 347-356 (1987). 22 Hirche, H.J. Mar. Biol., 106, 53-58 (1990). 23 Rees, C.B. Hull Bull. Mar. Ecol. 4, 211-246 (1957). 24 Jaschnov, V.A. Inst. Revue Ges. Hydrob. 55, 197-212 (1970). 25 Cushing, D.H. in Sea fisheries research. (ed.Harden-Jones, F.R.) 399-412 (Elek Science, London, 1974). 26 Brander, K. & Hurley, P.C.F. Can. J. Fish. Aquat. Sci. 49, 238-251 (1992). 27 Dickson, R.R. & Brander, K.M. Fish. Oceanogr. 2, 124-153 (1993). 28 Conover, R.J. et al. Clim. Res. 2, 69-82 (1995).
Aknowledgements We thank all past and present members of the CPR survey team. This study was carried out by the 'Programme National d'Océanographie Côtière' IFREMER / INSU, the MAST program of the European Commission and the French Ministry of Research. We also thank Patrick Chang, Amatzia Genin, Frédéric Ibañez, James W. Hurrell, Paul Nival, Philip C. Reid and Steve Worley for their advice.


Comments